The significance of data visualization is becoming more and more obvious in today’s rapidly developing digital landscape. The ability to condense difficult datasets into understandable visual representations has emerged as a crucial skill set as our world becomes filled with an unprecedented volume of information.
Data visualization is the process of presenting data in a way that makes it easier to see patterns, colors, and other elements that would otherwise be difficult to discern from the numbers and statistics themselves. This transformative process not only improves our ability to make well-informed decisions but also helps us gain a more in-depth comprehension of the complex interrelationships that exist within the data landscape.
The practice of data visualization goes far beyond the scope of straightforward data presentation; in its own right, it is an art form. A skilled data visualizer will carefully select colors, shapes, and other design elements to communicate a narrative within the data, much in the same way that a painter chooses colors to evoke a particular feeling in the viewer. This creative process calls for an intuitive understanding of the information at hand, which enables the visualizer to craft a story that resonates on a visceral level with the audience.
Data visualization requires, at its most fundamental level, an innate awareness of balance and composition. Every component should be in tune with the overarching message, and care should be taken to ensure that no one aspect dominates or distracts from the significance of the whole. Every pixel, curve, and layer in the visualization is the result of a conscious design decision that contributes to the effect the visualization has as a whole. This attention to detail is so exact that it resembles the precision of a sculptor who is chipping away at a block of raw material to reveal a finished masterpiece.
Data visualization is a medium that encourages innovation and experimentation, which is another advantage of the technique. Visualizers are inspired to test their limits, experiment with unconventional methods, and question the conventions that have been established. This ongoing transformation is a reflection of the creative process, in which artists explore unexplored lands in search of fresh angles from which to approach challenging concepts.
In addition, just like any game or a work of art, a carefully crafted data visualization can arouse a range of feelings and stimulate thought-provoking discourse. It can communicate with a global audience in a way that is both clear and resonant, despite being able to communicate across linguistic and cultural boundaries. It promotes a more profound connection between the observer and the data by inviting viewers to participate, pose questions about, and reflect on the narrative that lies beneath the surface.
The act of visualizing data is, at its core, not merely a technical endeavor but rather a creative endeavor that calls for an acute sensibility for form, color, and narrative. It is a form of artistic expression that gives life to raw data by transforming it into an entrancing visual experience that captivates, educates, and inspires its audience.
The Basics of Data Visualization
Data visualization is the art of representing data in a visual format, which paves the way for a clearer and more immediate comprehension of complicated datasets. At its core, it is predicated on the methodical application of graphical elements such as colors, shapes, and patterns in a strategic manner to convey significant insights.
The selection of suitable visual representations is a crucial component of data visualization, and it is one of the most fundamental principles. Performing this step involves selecting the kind of chart, graph, or diagram that is going to be the most effective in communicating the meaning of the data as well as the point you want to make. For instance, bar charts are useful for comparing a variety of categories, whereas line graphs are superior when it comes to displaying trends over some time.
In data visualization, color is an extremely important factor. It is possible to use it to draw attention to important components, differentiate between different categories, and highlight particular data points. However, it is essential to refrain from going overboard and make sure that the color choices you make are obvious and approachable to a large number of people.
In addition, the arrangement and layout of components contained within a visualization are critical components to consider. Having appropriate spacing, alignment, and labeling helps to reduce visual clutter and directs the viewer’s attention to the information that is most pertinent to them. A well-designed visualization should be simple to understand at a glance, with a clear and concise presentation of the data.
The visual representation gains context and meaning from the annotations and labels that are added to it. They assist in the explanation of trends, the identification of outliers, and the highlighting of significant points of interest. It is possible to improve the narrative of the visualization as a whole by making thoughtful use of titles, legends, and captions.
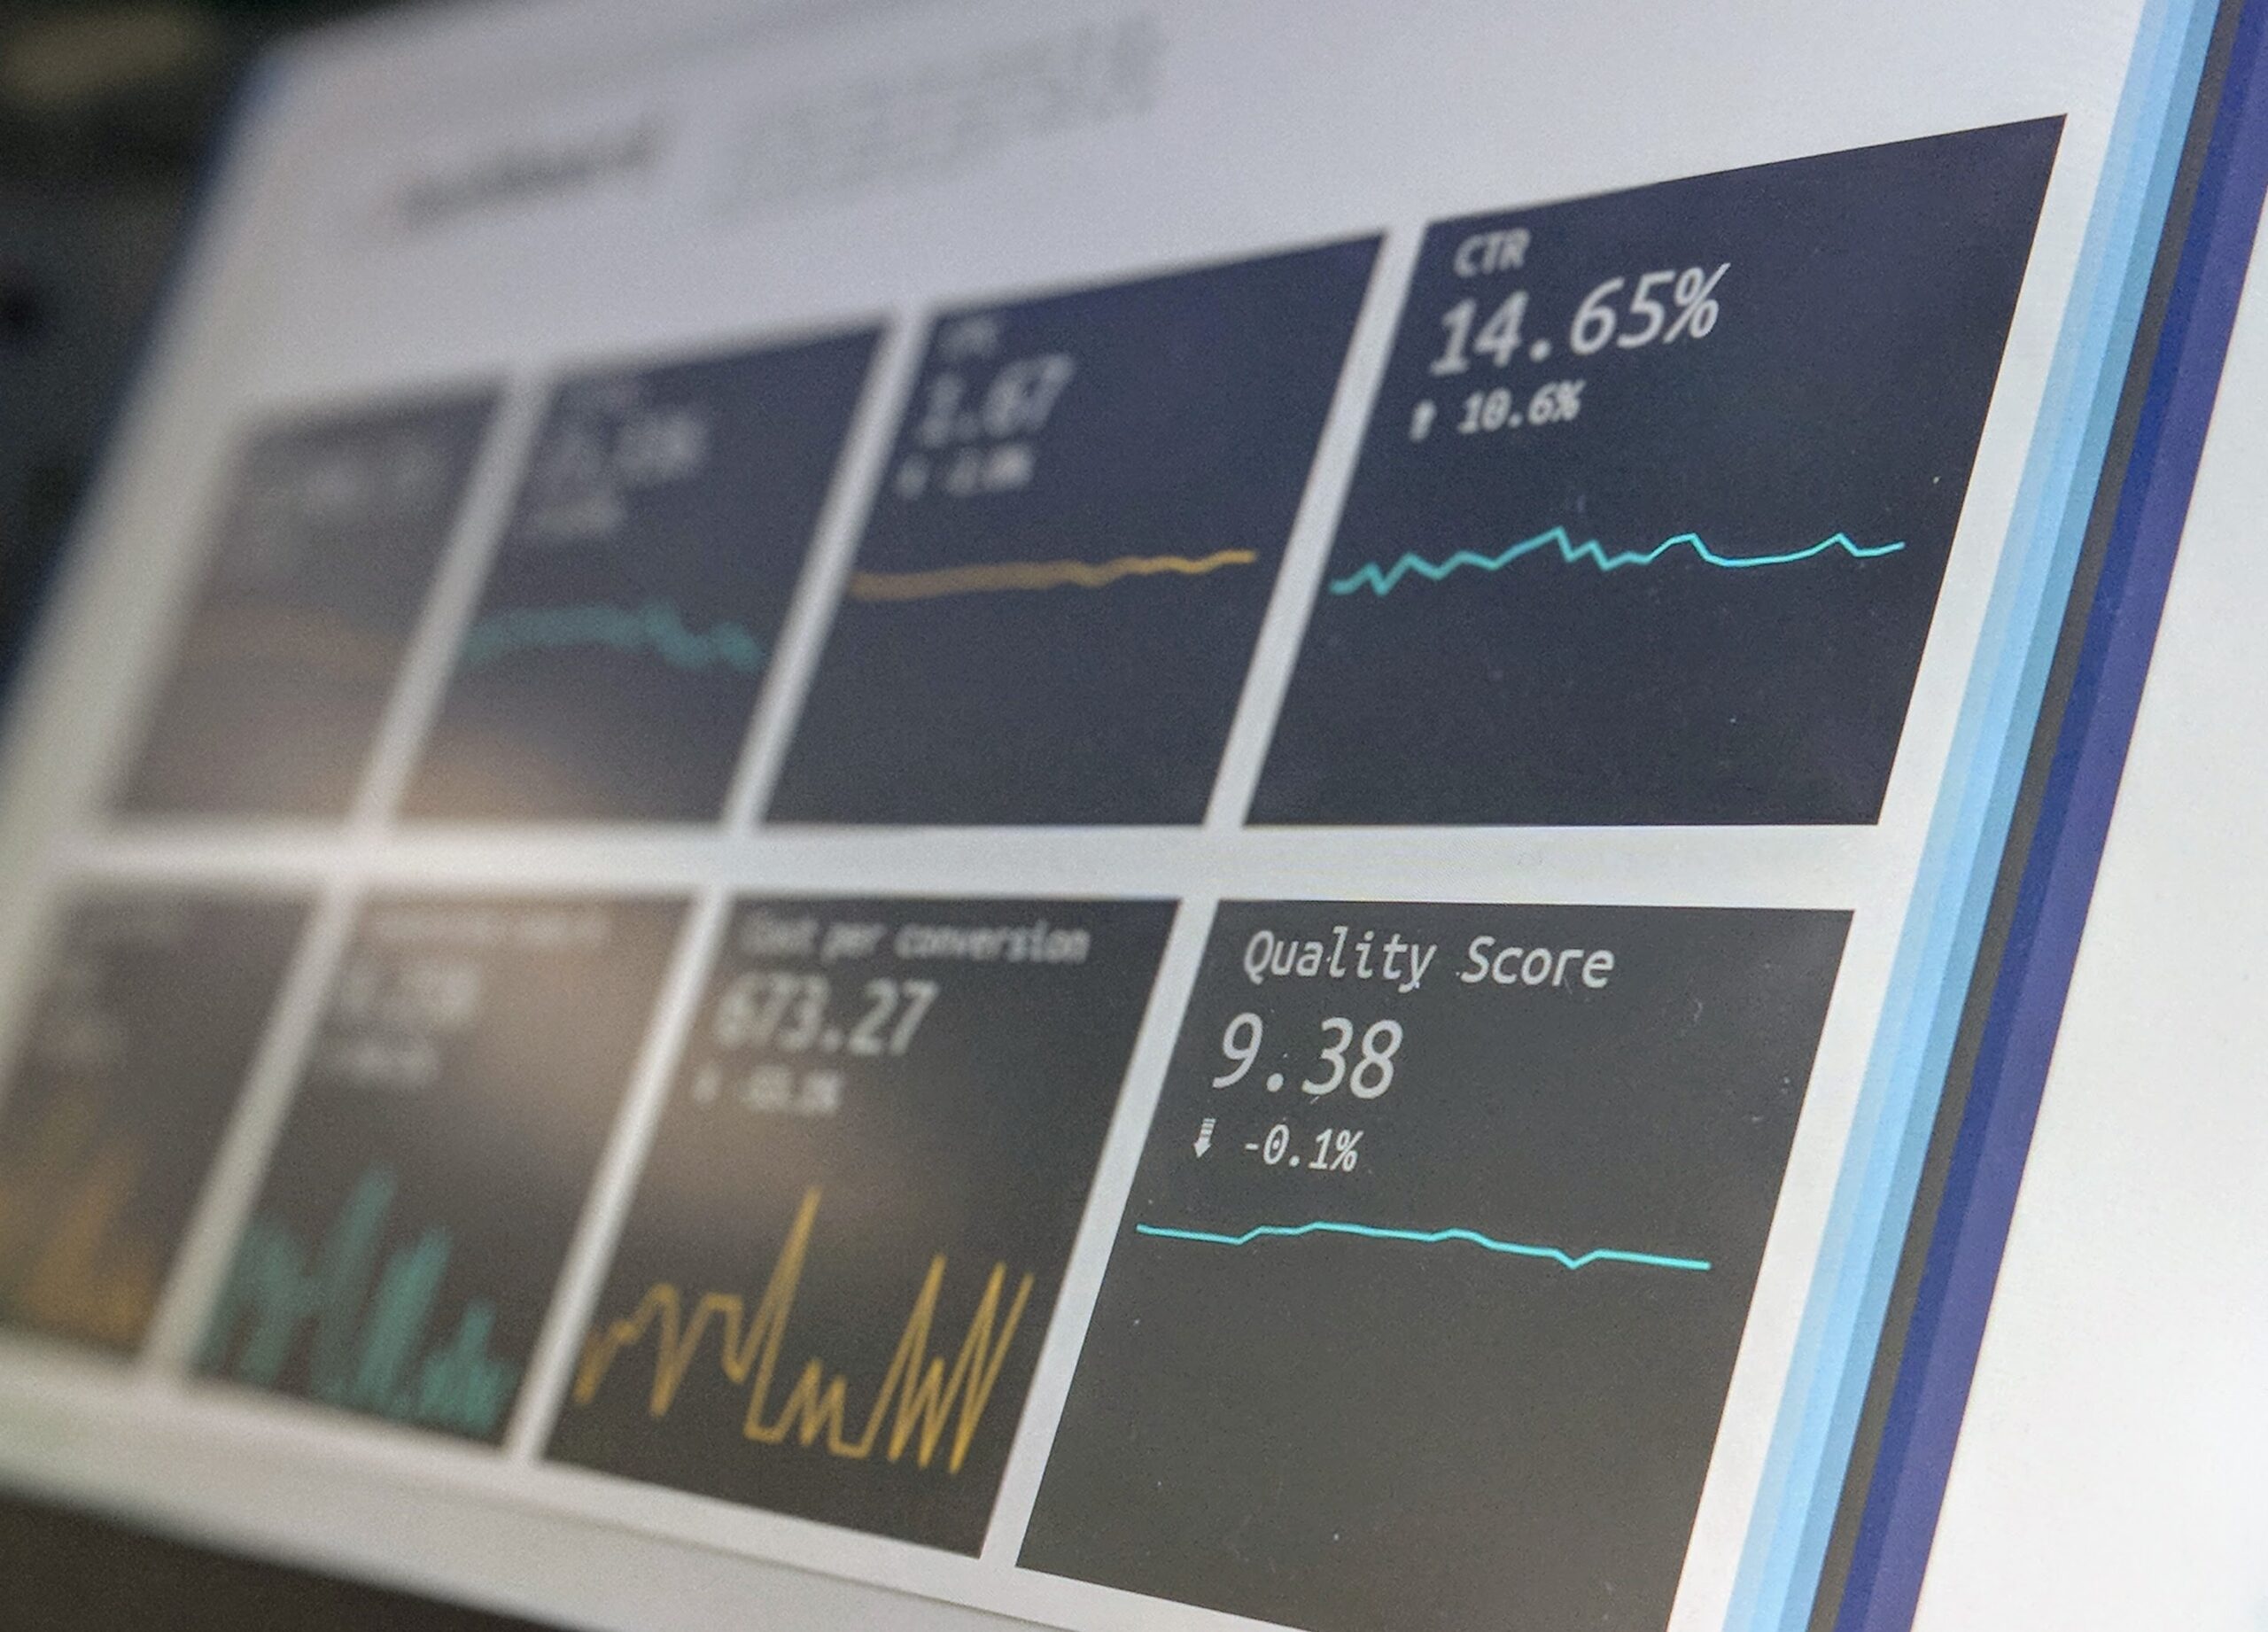
Data visualization makes use of several powerful tools, one of which is interactivity. It gives users the ability to explore the data on their terms, making for an experience that is both more engaging and uniquely theirs. A more in-depth investigation of the information can be facilitated with the help of interactive elements such as tooltips, filters, and zooming features.
Last but not least, it is essential to take into account the audience that the visualization is designed for. The success of the message’s dissemination can be ensured by adapting both the design and the level of complexity of the visualization to the degree to which the target audience is already versed in the subject matter.
In its most fundamental form, mastering the fundamentals of data visualization requires a combination of careful design decisions, an in-depth understanding of the data, and an awareness of the audience for whom the visualization is intended. Data visualization has the potential to transform complicated information into a visual narrative that is understandable, compelling, and actionable when it is done correctly.
What is Data Visualization?
Data visualization is a highly effective technique for communicating intricate information or patterns that characterize data using visual components. Data visualization covers the representation of datasets through graphical or pictorial means, facilitating enhanced comprehension and analysis. Data visualization utilizes visual cues, such as shapes, colors, and spatial arrangements, to effectively convey insights, instead of relying solely on lists or numerical figures.
Data visualization is a process that takes raw data and converts it into meaningful visual stories by making use of charts, graphs, maps, and other various graphical elements. It enables people to quickly grasp trends, relationships, and outliers within a dataset, which enables them to make more informed decisions.
The purpose of this visual approach is to discover hidden patterns, correlations, and anomalies that might not be immediately apparent when looking at raw data. This can be accomplished by displaying the data in a certain way. It enables the exploration of large and complex datasets, providing a means to distill important information and arrive at meaningful conclusions.
In addition, data visualization acts as a global language that can communicate effectively across linguistic and cultural divides. It enables effective communication of information to diverse audiences, which makes it an invaluable tool in fields ranging from business analytics and scientific research to journalism and education.
The process of data visualization involves the conversion of data into visually comprehensible formats, thereby enhancing comprehension of information and promoting more efficient communication and analysis. The utilization of visual elements enables individuals to derive significant insights, thereby facilitating informed decision-making across diverse domains.
What are the Types of Data Visualizations
Infographics
Infographics are graphical representations of information that are intended to communicate difficult concepts in a way that is both understandable and interesting. They incorporate text, images, charts, and graphics to render the information simple to comprehend and easy to recall for a particular audience. Infographics can be used for a variety of purposes, including but not limited to the presentation of data, the provision of instructional guides, the comparison of information, and the narration of stories. They are utilized extensively in the fields of marketing, education, and communication to effectively convey information and visually engage viewers.
Pivot Tables
In spreadsheet software, pivot tables are tools that can be used to analyze and summarize significant amounts of data in a manner that is clear and well-organized. They provide users with the ability to rearrange and manipulate data to gain insights, recognize patterns, and make decisions based on the data. Data sets can be more easily comprehended and meaningful inferences can be drawn from them with the assistance of pivot tables, which offer a dynamic method of aggregating and grouping information.
Boxplots
Boxplots are graphical representations that are utilized to display the purpose of displaying a dataset’s distribution, central tendency, and variability. They offer a graphical representation of the most important statistics that can be found in a set of numerical data, such as the median, quartiles, and potential outliers. This makes it easier to understand the spread and skewness of the data, as well as to identify any unusual observations that fall significantly outside of the typical range. Specifically, this makes it easier to understand the spread of the data and the skewness of the data. Boxplots are helpful tools for visualizing and comparing data across a variety of different categories and groups of people.
Bar Chart
Bar charts are a type of data visualization that can be used to display and compare different types of data. They are made up of rectangular bars, and the length or height of each bar represents the frequency, count, or proportion of the respective category. Bar charts offer a straightforward method of visually representing the relative sizes or frequencies of various groups or categories, which makes it simple to recognize patterns, trends, or disparities in the data. They are used extensively in a wide variety of fields to present information in a format that is comprehensible, straightforward, and simple to grasp.
Line Chart
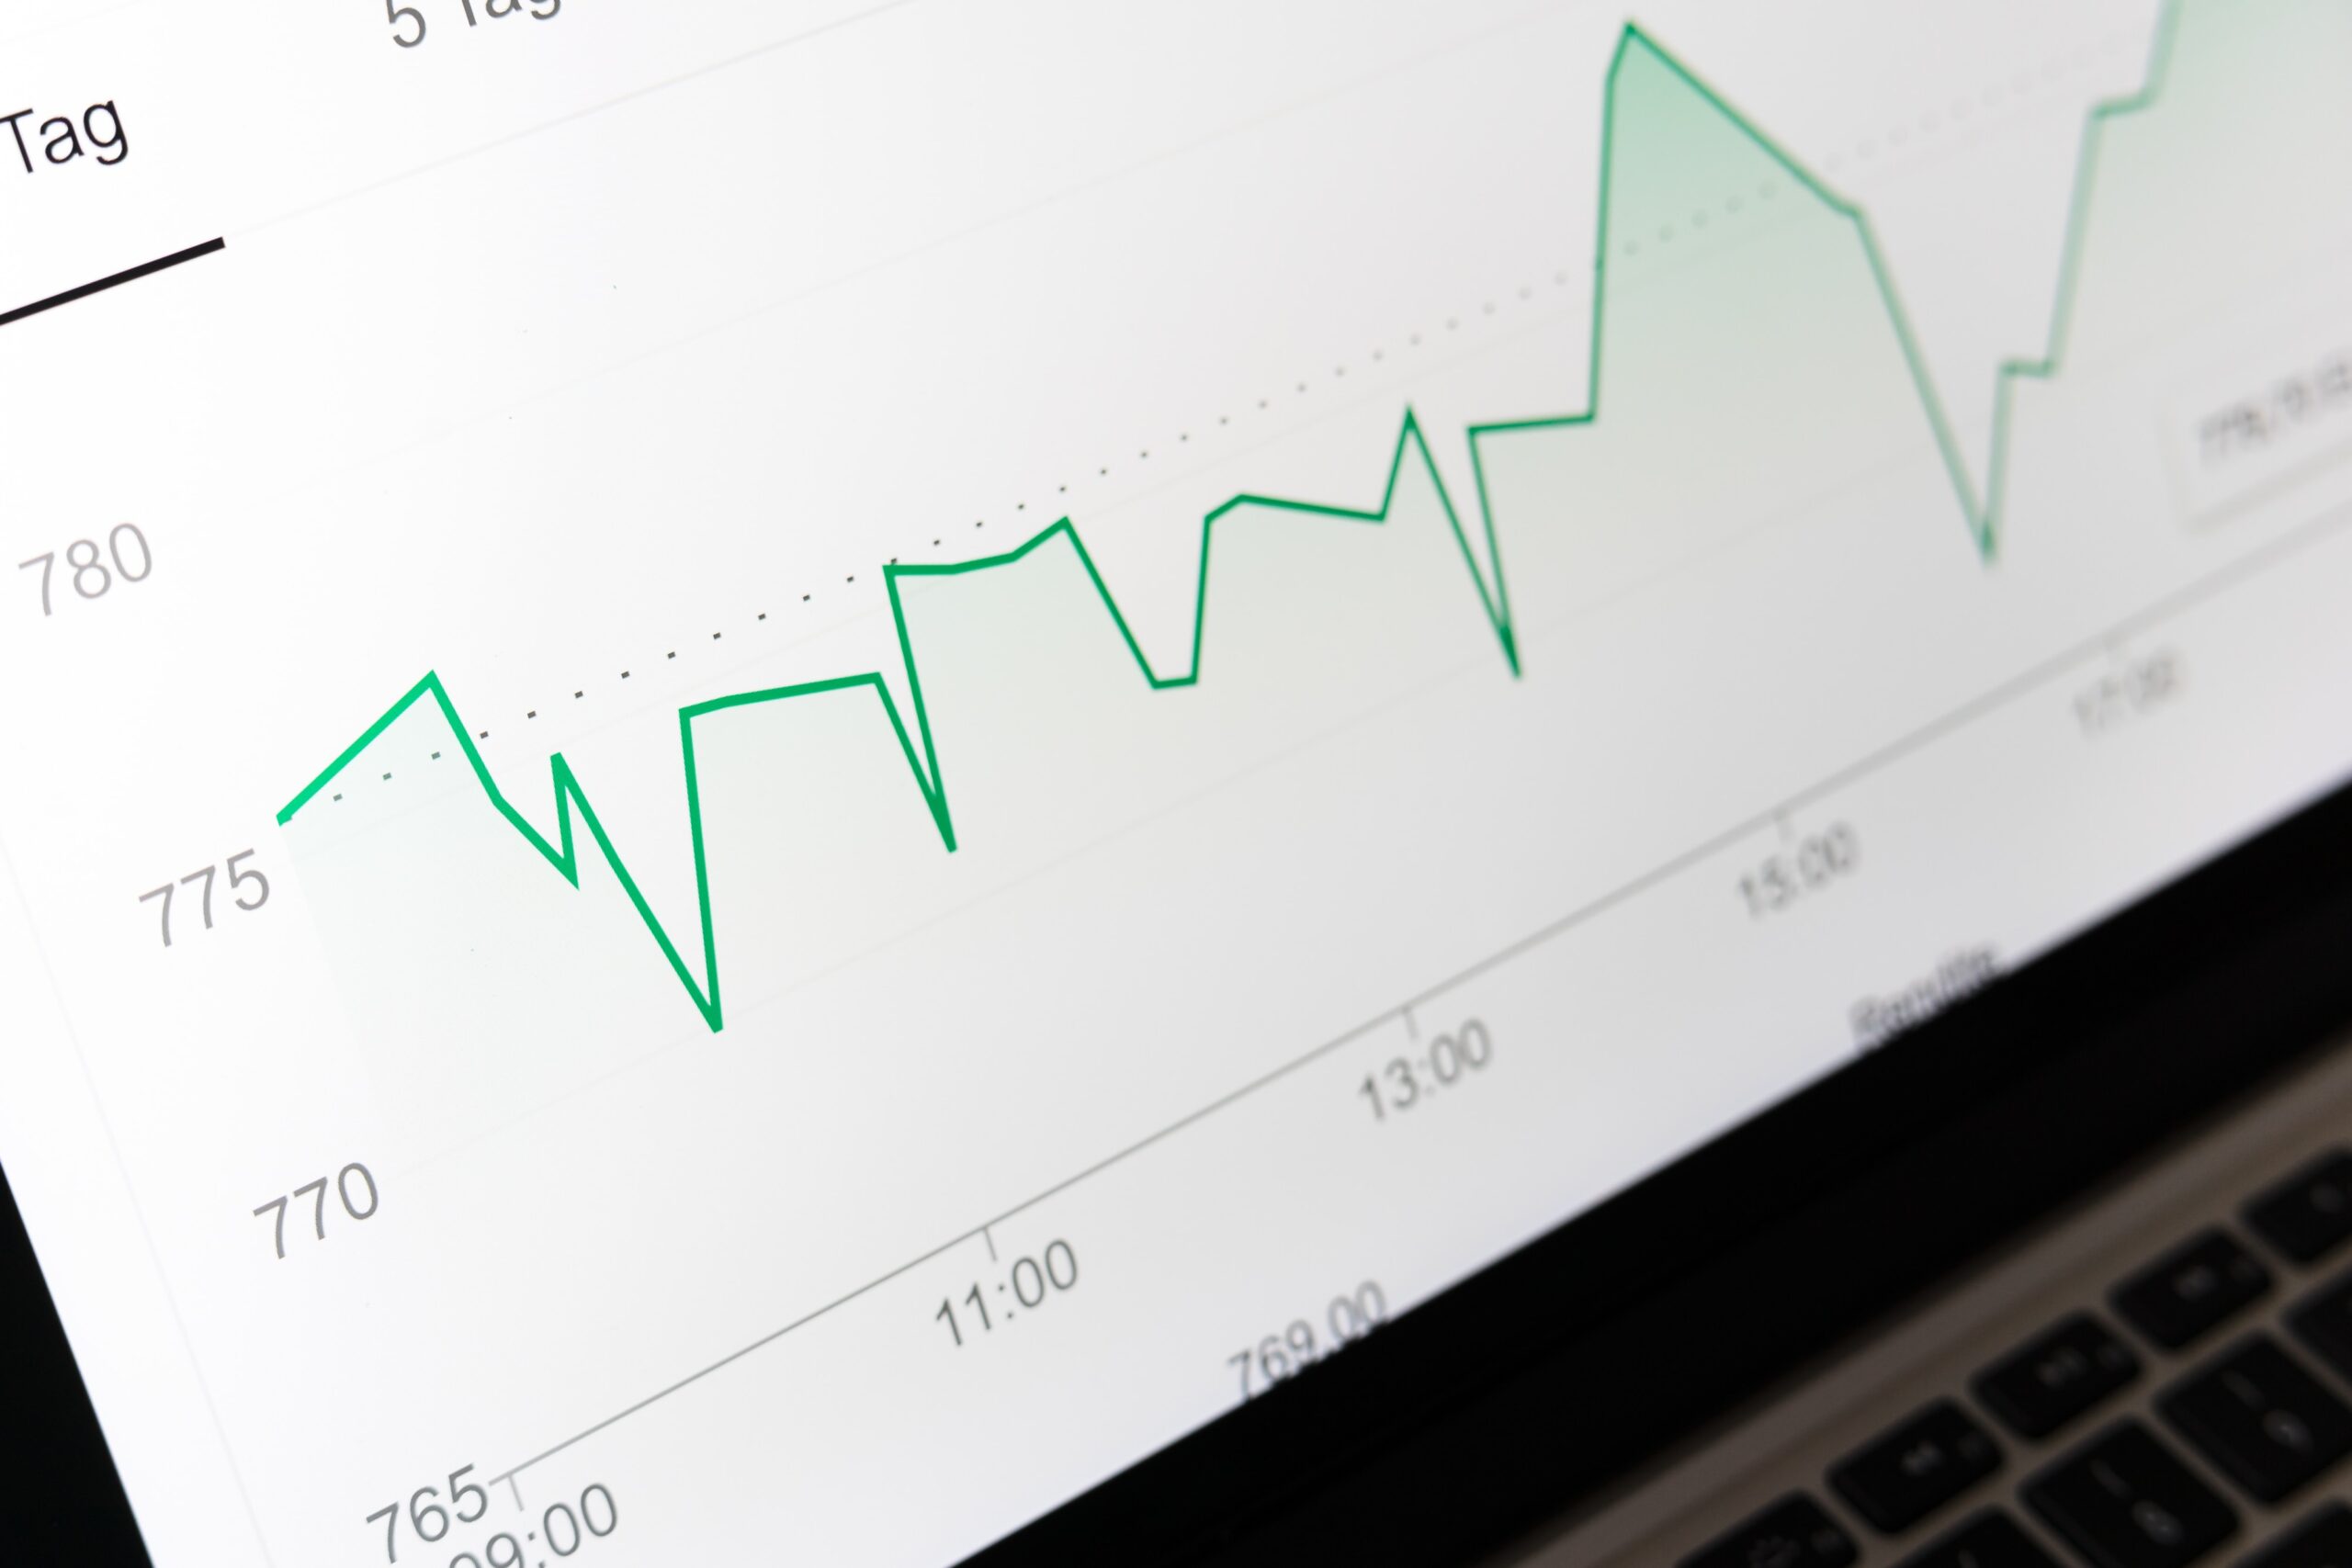
Line charts are a type of data visualization that can be used to plot points of data over a continuous period or space. They are made up of a string of points that are linked together by lines that illustrate the progression, trend, or relationship between the data points. Line charts are particularly helpful for visualizing trends, patterns, and changes in data over time. Line charts can be found here. They are an extremely helpful tool for both the analysis and presentation of data because they offer a method that is both clear and easy to understand for comprehending how variables change over time or interact with one another.
Pie Chart
Pie charts are circular graphs that are used to represent data in a way that shows the relative proportions or percentages of different categories within a whole. This can be accomplished by comparing the total area of the chart to the total area of the pie. Each “slice” of the pie represents a particular category or subcategory, while the entire circle illustrates the entirety of the data set (which is 100%). The size of each slice is calculated according to the percentage of the whole that it represents. When displaying data with a limited number of categories and when it is essential to emphasize the distribution or composition of a whole, pie charts are one of the most effective types of charts to use.
Histogram
Histograms are data visualizations that can be used to show how a continuous dataset is distributed. They are made up of a series of bars that are arranged in a row next to one another. The width of each bar represents a particular range or interval of data values, and the height of each bar represents the number of occurrences of observations that fall within that range. Histograms offer a graphical summary of the data’s distribution, central tendency, and variability, which makes it much simpler to comprehend the structure and attributes of the dataset. They are particularly helpful for recognizing patterns, potential trends, and outliers in the data.
Scatter Plots
Scatter plots are data visualizations employed to illustrate the correlation between two variables that are measured on a continuous scale. The data points are comprised of individual observations that are graphically represented on a two-dimensional coordinate system, where one variable is depicted on the horizontal x-axis and the other variable is depicted on the vertical y-axis. Every data point in the dataset represents a distinct combination of values for both variables. Scatter plots serve as a valuable tool for visually evaluating the correlation, trend, or pattern that exists between variables. Correlation coefficients can provide valuable insights regarding the magnitude and direction of the relationship between variables, while also facilitating the identification of potential outliers or clusters within the dataset. Scatter plots are frequently employed across diverse disciplines such as statistics, economics, and scientific research to investigate and comprehend the relationships between variables.
Area Charts
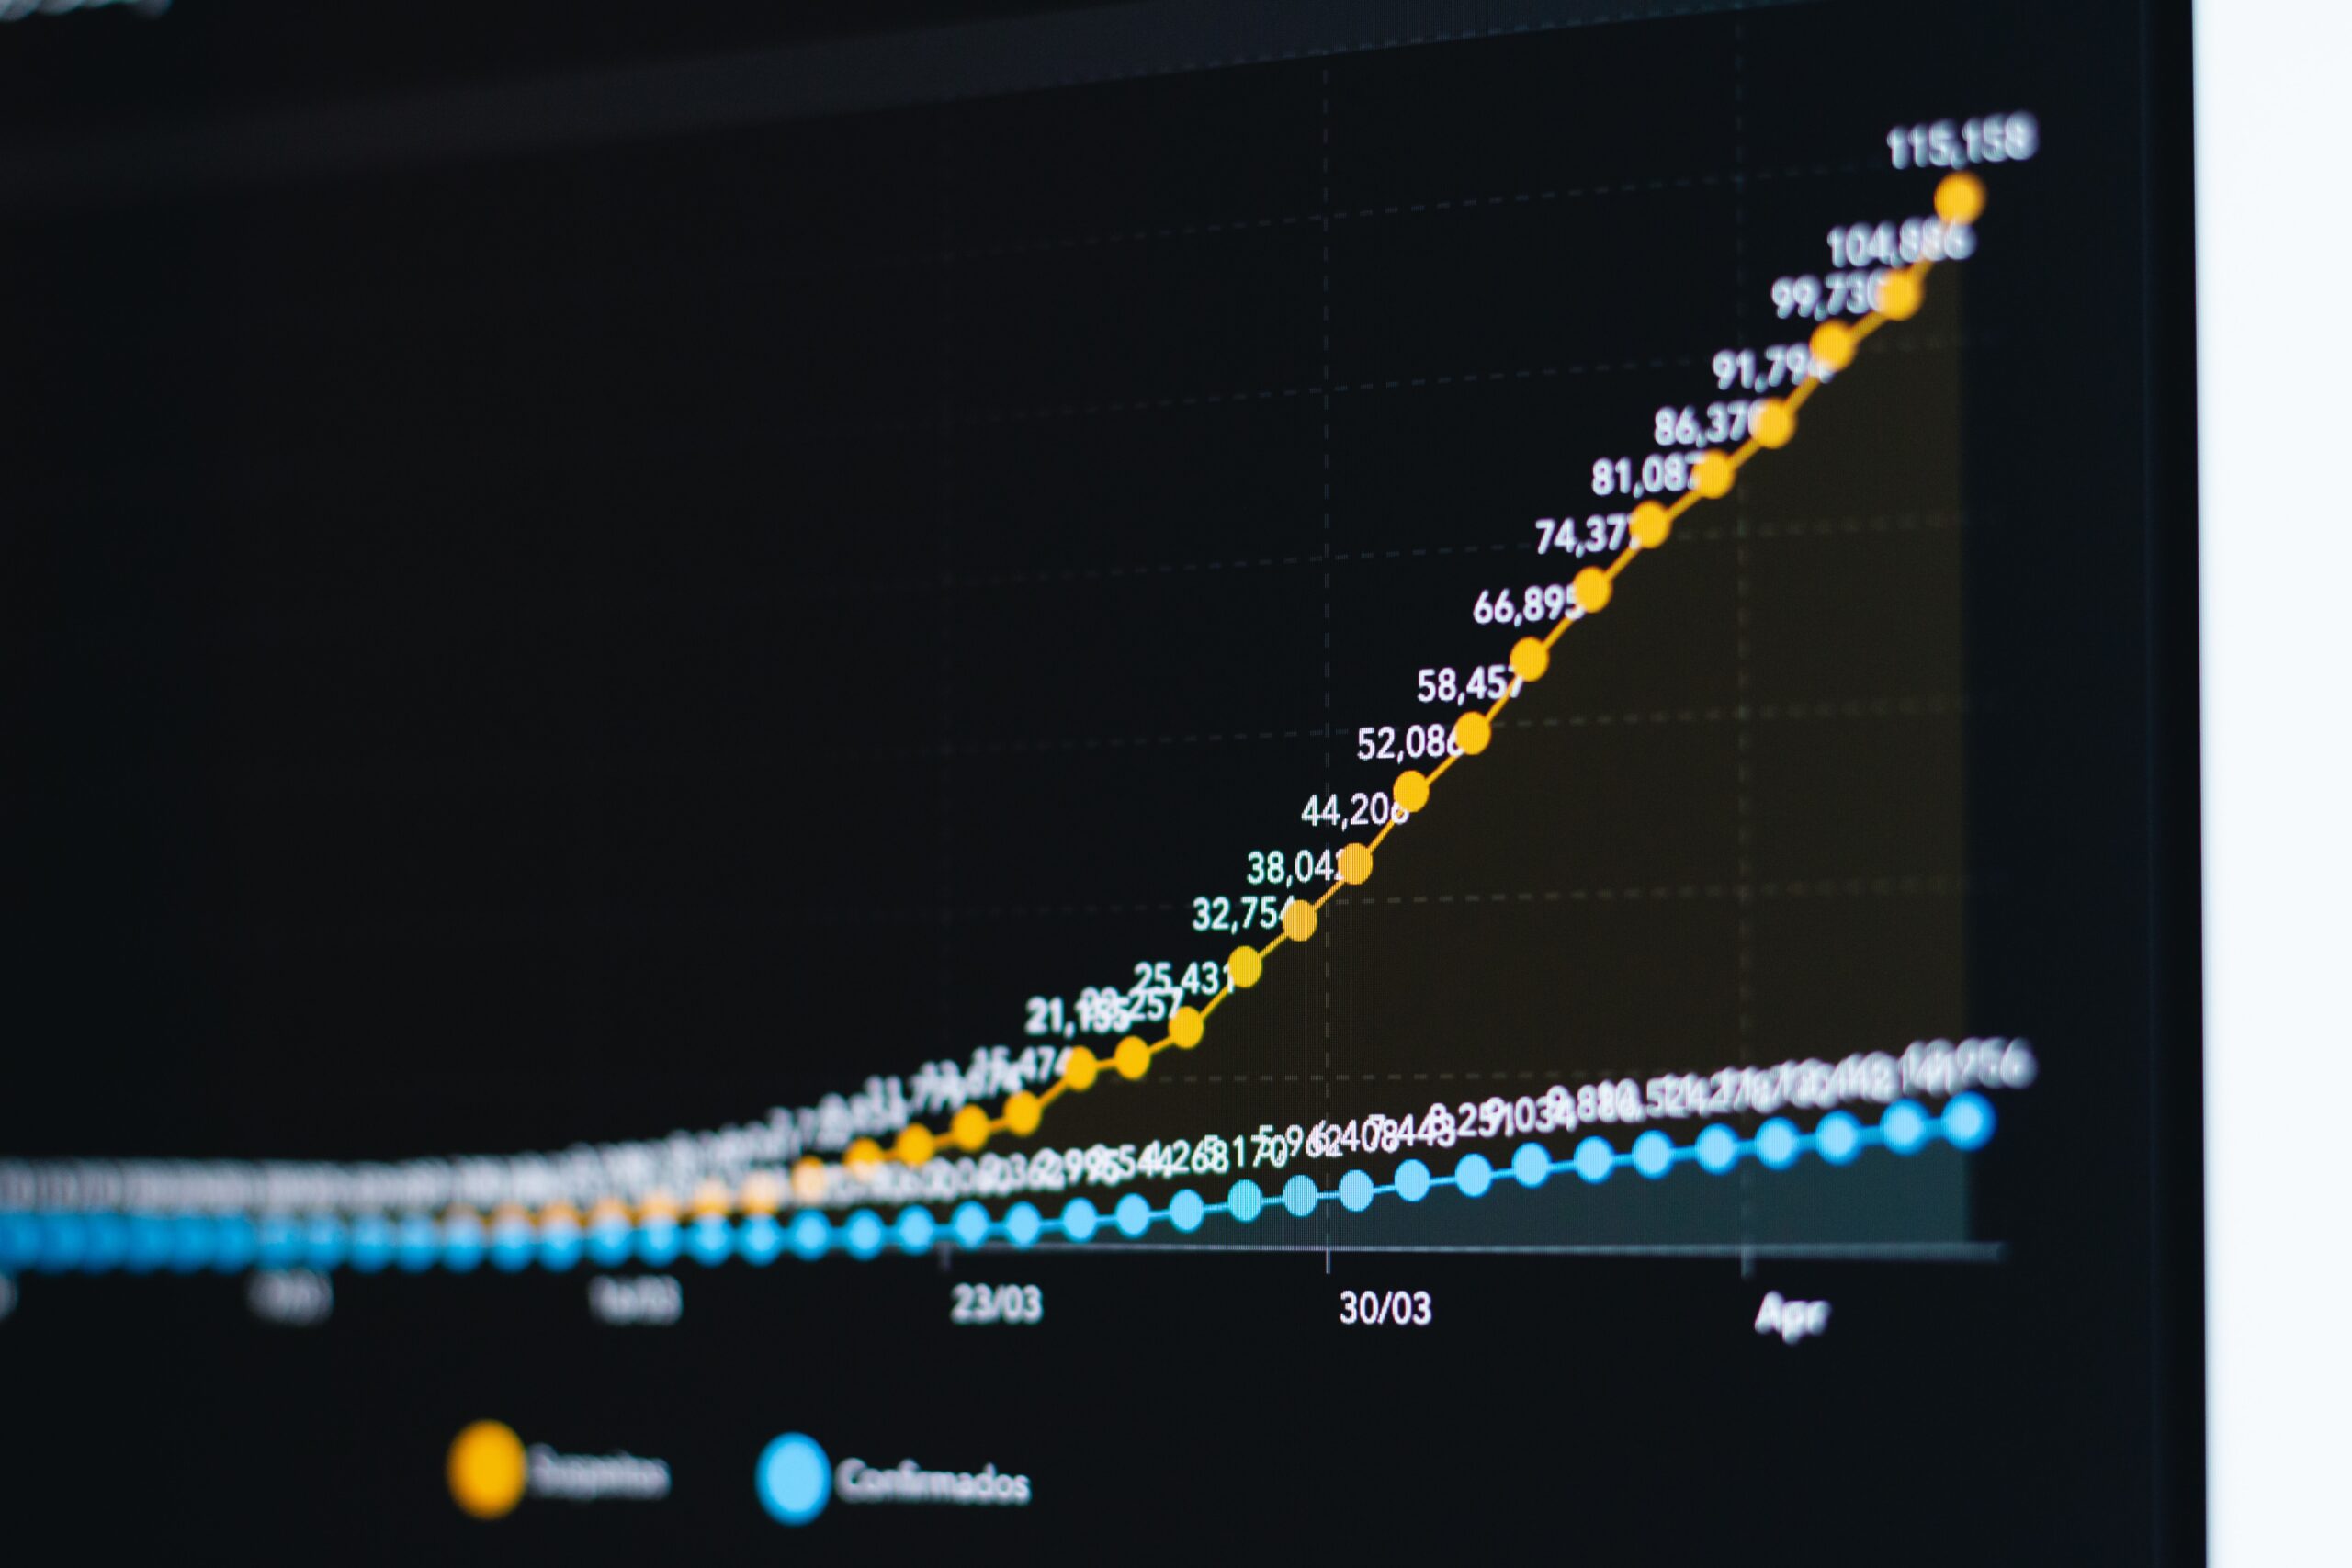
Area charts are data visualizations employed to present numerical data visually, either about the passage of time or across different categories. Area charts share similarities with line charts, however, they differ in that area charts incorporate the filling of color below the line. This color filling serves to accentuate the extent of change or comparison among various categories or datasets. Area charts are a highly effective visual tool for depicting the progression of trends, patterns, and the cumulative sum of data points. Line graphs are frequently employed in disciplines such as finance, economics, and related fields, wherein the visualization of temporal fluctuations in values and comprehension of their overall magnitude hold significance.
Heat Map
Heat maps are data visualizations that are used to visualize data in a way that emphasizes the magnitude of values contained within a dataset. These graphical representations can be found in statistical software. They do this by utilizing color gradients to represent the different levels of a variable, with darker colors indicating higher values and lighter colors indicating lower values. The display of large amounts of data and the identification of patterns, trends, or areas of high or low concentration can be greatly aided by the utilization of heat maps. In fields such as data analysis, biology, and web analytics, they are frequently used to provide a visual summary of information that is otherwise difficult to understand.
Network Graphs
Network graphs, commonly referred to as graphs or network diagrams, serve as data visualization employed to illustrate the interrelationships and connections among diverse entities or nodes. Entities can encompass a diverse array of entities, including individuals, institutions, computing systems, or abstract ideas. The connections, denoted by lines or edges, signify a certain type of association or engagement between the nodes.
Network graphs are powerful tools that can be used to visualize complex systems, discover patterns, and gain an understanding of the structure of data that is interconnected. Analysis of social networks, biology (to represent biological pathways), transportation (for modeling routes), and information technology (to illustrate computer networks) are all fields that make extensive use of them.
Through the analysis of the arrangement, concentration, and interconnections observed in a network graph, researchers can acquire significant knowledge regarding the fundamental framework and evolving behavior of the system under study.
Geographical Maps
Geographical maps are data visualizations that visually depict the Earth’s surface or a specific region of it, typically rendered on a two-dimensional plane. Spatial information is furnished about the geographical positioning, demarcations, and characteristics of diverse locations across the globe.
These cartographic representations can encompass a diverse array of information, including but not limited to geopolitical demarcations, topographical characteristics (such as mountain ranges, rivers, and bodies of water), transportation networks, urban centers, and additional pertinent data.
Geographical maps are vital instruments utilized for navigation, strategic planning, educational endeavors, and diverse forms of research or analysis that necessitate spatial context. These representations can be displayed in diverse formats, encompassing physical maps, electronic maps, and interactive web-based maps.
Radar Chart
Radar charts are data visualizations that are used to display multivariate data in a way that shows the relationship between multiple variables across different categories or dimensions. They are also known as spider charts and web charts. They are made up of an arrangement of spokes or radii that are all the same distance apart and radiate outward from a central point. Each spoke, or radius stands for a different variable. Plotting the data points for each variable along these spokes, and then connecting them to form a closed shape, is what is meant by “plotting.” This shape offers a graphical illustration of the general pattern or profile of the data that was collected.
When comparing the performance or characteristics of different categories across multiple dimensions, radar charts are an especially helpful tool to use. They are utilized frequently in fields such as business (for performance analysis), market research (to evaluate product features), and sports (to compare player statistics). They offer a concise and understandable graphical summary of how various variables contribute to an overall pattern or profile.
What is the Importance of Good Design in Data Visualization?
Effective design is essential to data visualization because it improves comprehension and communication. It makes complicated information easier to understand and absorb for a larger audience by simplifying it. Good design decisions direct the viewer’s gaze, draw attention to important insights, and make interpretation easier. Better decision-making and insights can result from the swift and accurate communication of information through a well-designed visualization.
Moreover, it increases the impact and value of information by making it more captivating and memorable. Furthermore, because it shows a degree of professionalism and consideration in the information it presents, good design can increase confidence in the data and the message it conveys. All things considered, effective data visualization design is crucial to optimizing the usefulness and impact of the information being displayed.
Tools and Software
The importance of data visualization tools and software has become crucial in the ever-evolving realm of data-driven decision-making. These advanced applications provide individuals and organizations with the ability to convert unprocessed data into valuable insights, facilitating better decision-making and enhancing communication effectiveness.
By utilizing a variety of visual aids such as graphs, charts, maps, and interactive visual representations, these tools serve to not only improve understanding but also reveal intricate patterns, trends, and connections within intricate datasets. Here’s an elaborate description of each popular data visualization tool:
Tableau
Tableau is a popular data visualization tool that stands out for its impressive functionality and user-friendly interface. It gives users the ability to connect to a variety of data sources and create visualizations that are both interactive and shareable. Users of Tableau can create compelling dashboards by dragging and dropping elements thanks to the intuitive interface the software provides. It is compatible with a wide variety of data formats and provides advanced analytics features for more in-depth analysis of the data.
Power BI
Power BI is a comprehensive business analytics tool that has been developed by Microsoft. The software offers interactive visualizations and business intelligence functionalities, rendering it a widely favored option among various organizations. Power BI exhibits a high level of compatibility with various Microsoft software solutions, facilitating smooth integration. Additionally, it provides a user interface that is intuitive and easy to navigate, enabling users to generate dynamic reports and dashboards with ease. The software provides extensive support for various data connectors and facilitates seamless data transformation and modeling processes.
Google Data Studio
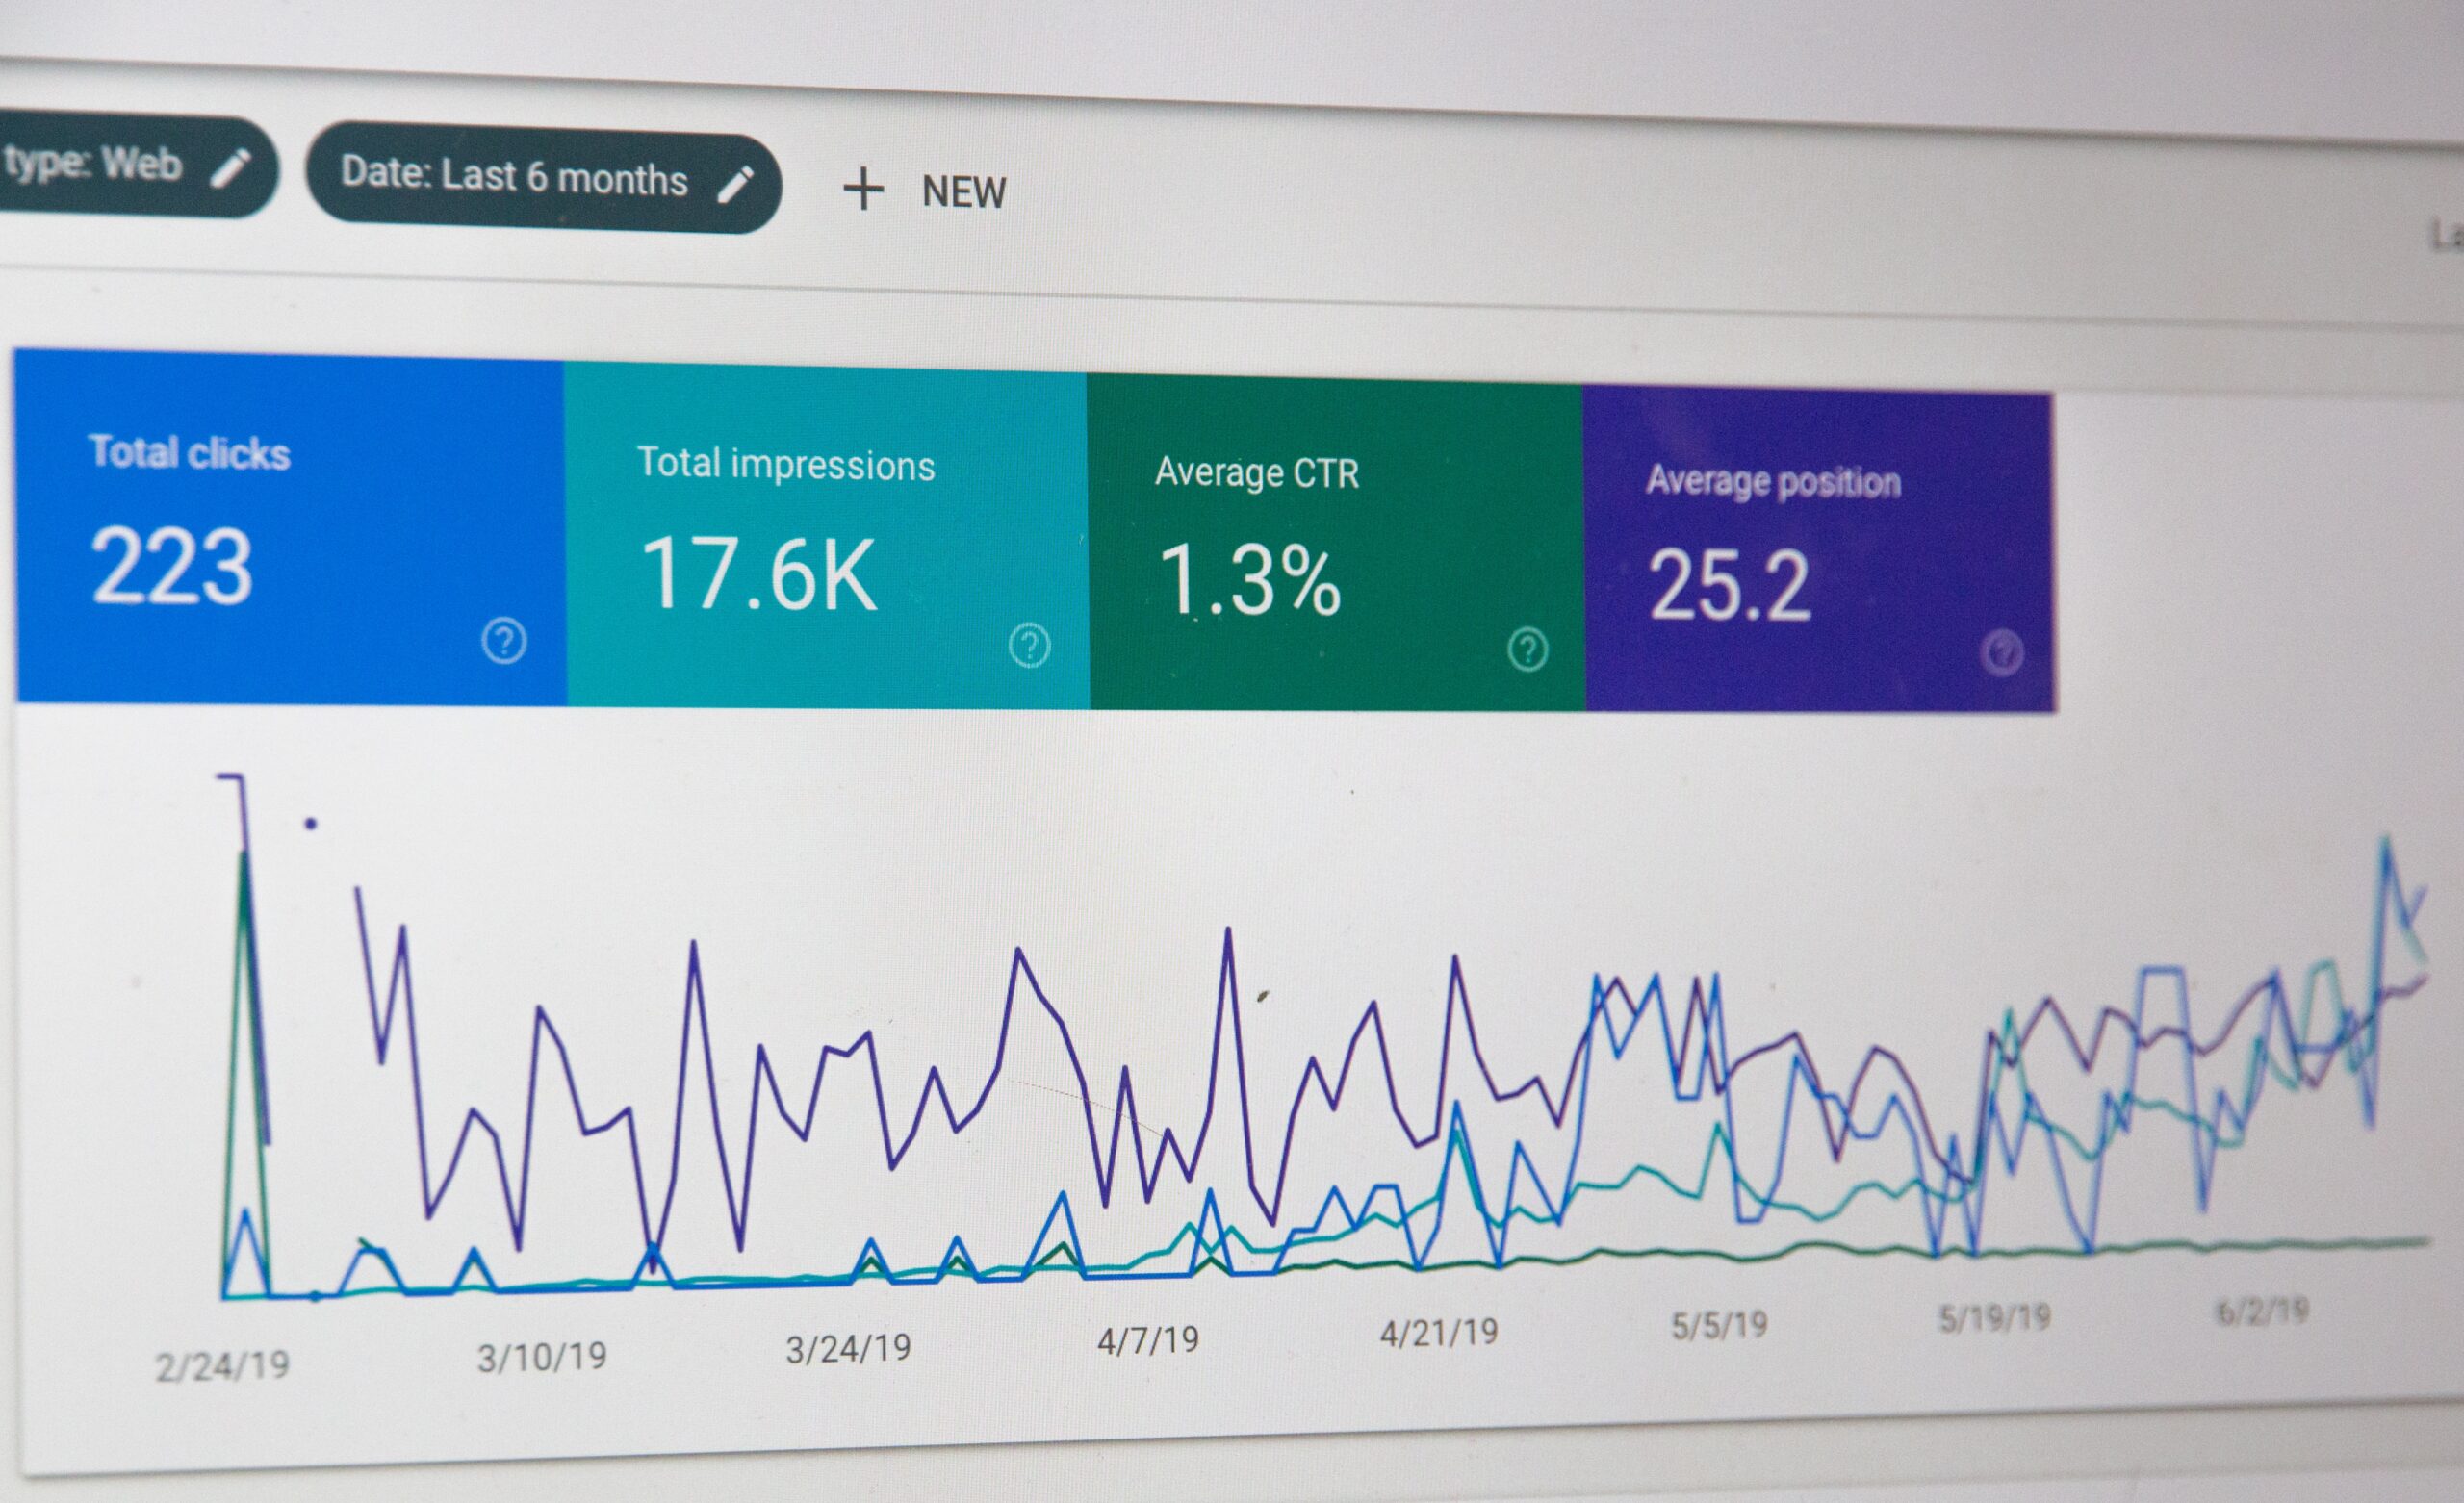
Google Data Studio is a no-cost software solution provided by Google that enables the creation of comprehensive and visually captivating reports and dashboards. The software seamlessly integrates with various Google services, including Google Sheets, Google Analytics, and other related platforms. Users can effortlessly establish connections with diverse data sources and create personalized visual representations. Google Data Studio places a strong emphasis on fostering collaboration among teams, enabling them to engage in real-time collaboration while working on reports.
D3.js
D3.js is a JavaScript library that enables developers to generate dynamic and interactive data visualizations within web browsers. This framework offers a robust structure for constructing bespoke visualizations from the ground up. D3.js provides extensive control over the visualization process, enabling the development of distinctive and highly tailored graphics. Developers commonly utilize this technology to construct web applications that are driven by data.
QlikView/Qlik Sense
QlikView and Qlik Sense are powerful instruments utilized for business intelligence and visual analytics purposes. The company provides business users with dynamic data visualizations and exploration capabilities. QlikView primarily emphasizes guided analytics by offering pre-constructed dashboards tailored to specific use cases. In contrast, Qlik Sense places a strong emphasis on self-service analytics, affording users the capability to independently explore and visualize data.
Plotly
Plotly is a multifaceted Python library that enables the creation of interactive and visually appealing visualizations suitable for publication. The software provides extensive support for various types of charts, encompassing fundamental line charts, three-dimensional plots, and geographic maps. Plotly is a versatile tool that can be employed in multiple programming languages, such as Python, R, and Julia. Creating visually appealing and interactive plots is widely favored by data scientists and analysts.
Looker
Looker is a comprehensive business intelligence and data exploration platform that empowers users to generate and distribute reports and dashboards. The system prioritizes the process of data exploration and discovery, allowing users to delve further into their data to gain more profound insights. The Looker platform provides a centralized solution for the analysis and visualization of data, rendering it a widely favored option among teams engaged in the manipulation of extensive datasets.
Google Earth Studio
Google Earth Studio is not a traditional data visualization tool; however, it can be used to create animated maps and geospatial visualizations. It is especially helpful for visually representing geographical data in a way that is both dynamic and interesting. Users can create their animations with interactive components, which makes it an extremely useful tool for telling stories using location-based data.
Infogram
Infogram is a web-based application that facilitates the production of interactive infographics and data visualizations. Users with varying degrees of design expertise can utilize the software because it provides a diverse selection of pre-made layouts and personalization options. Infogram is frequently utilized for the creation of visually engaging reports and presentations that include components driven by data.
RawGraphs
RawGraphs is a tool that is based on the web and is open-source. It enables users to create vector-based visualizations that are unique to them. It is compatible with a wide variety of data formats and provides a base for the creation of original graphical representations. RawGraphs is particularly well-liked by designers and developers who are interested in developing one-of-a-kind visualizations for the data projects that they are working on.
Adobe Illustrator
Adobe Illustrator is a powerful piece of software for graphic design that can be utilized for a variety of purposes, including the production of individualized data visualizations and infographics. Even though it is not a tool specifically designed for data visualization, it does provide a platform for designers to create graphics that are highly customizable and visually engaging. Because it contains such a comprehensive set of drawing and design tools, Adobe Illustrator is an excellent choice for developing individualized visualizations.
Highcharts
Highcharts is a charting library written in JavaScript that enables users to create charts for the web that are both interactive and aesthetically pleasing. It provides a diverse range of chart types, such as line charts, bar charts, and pie charts, amongst others. Because of its reputation for being compatible with a wide variety of programming languages, Highcharts is a well-liked option among web developers who are interested in incorporating dynamic charts into their applications.
These tools accommodate a variety of user preferences as well as the specific needs of individual projects. One of these tools might be more appropriate than the others for a data visualization project, depending on the particular requirements that need to be met.
Conclusion
Data visualization provides an exciting and interesting avenue for hobbyists to study and make sense of their interests and passions in a way that is both dynamic and engaging. Hobbyists can transform raw data into representations that are both insightful and visually appealing by employing a wide variety of data visualization techniques. This not only improves their understanding of the topic at hand but also makes it easier for them to convey their findings to others in an understandable manner.
Enthusiasts can unlock new dimensions of enjoyment and discovery in their chosen pursuits by embracing data visualization, thereby turning data into a powerful tool for creativity and exploration in their chosen activities. The skill of visualizing data enables enthusiasts to delve deeper into their interests and share their insights with a wider community. This is true whether the interest is in monitoring the progression of a personal project or unearthing hidden patterns in a cherished hobby.
Therefore, embracing data visualization is not only a valuable skill for hobbyists, but it is also a gateway to a more fulfilling and enlightening experience in their respective areas of interest that they have chosen.

